Interface
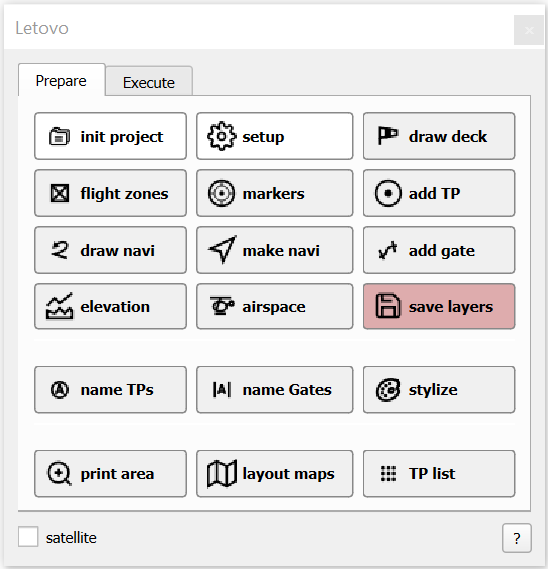
Click on any button in the interface above to jump to its description
Init Project
Initiate project
Can be used to create and set up an entire new project. Creates, names and styles all necessary layers in the project and folders in the project's location.
Do NOT rename these.
Setup
Click it to define default dimensions of turnpoints, gates/navigation corridors and minimum altitude required pilots should be flying above.
These dimensions will be used both by tools for drawing the features on the map and scripts evaluating different tasks (backtracking and corridor precision calculations use these values).
Draw Deck
Left-click to start drawing a new deck, right-click out of it to finish and name it.
Left-click and drag to move the points of the existing deck (or the one being drawn), right-click the points to remove them. Right-click the middle of the existing deck to remove it and right-click anywhere else to finish deck editing. This geometry is used to detect deck landing (not very reliably due to imprecisions in altitude above ground calculation and altitude measuring) and to determine distance of the turnpoints.
Flight Zones
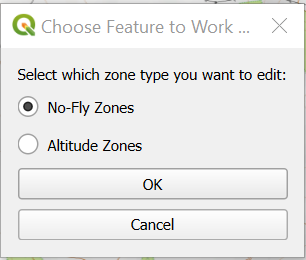
There are 2 options:
No-fly zone, which behaves pretty much the same as Draw deck. If the tracking data crosses this geometry, it's reported in the final result.
Altitude zone. Make zones to define specific altitude limitations. After finishing the polygon, you can choose a value. Negative value sets a ceiling (maximum AGL). 0 value excludes the area from altitude check (useful around airfield). Positive value overrides the minimum altitude set in the project settings. You can set it to 300m over specific cities for example.
Markers
Creates a Markers layer, where you can mark the locations of the markers you placed in the terrain. And select one of the 12 commonly used symbols.
This layer is used with the web interface where pilots mark their findings. Existing markers can be moved and removed by dragging or right-clicking.
Add TP (Add Turn Point)
Creates OB (reference to my language) layer with circular features (diameter defined in setup) with name and point value.
Left-click on a turnpoint starts moving the feature (it remains stationary, but another click moves it to a new location), right-click removes the feature. Right-click anywhere else exits the edit mode.
Add Gate
If a navi_ layer is selected this tool will create a corresponding gate_ layer (or start editing an existing one). If something else is selected, it will create or edit a Gates layer with standalone gates.
Right-click on gate removes it. The gates added to a navigation are perpendicular to the corridor (and snapping). The standalone gates can be rotated after the initial click. And their ends can be dragged to resize them (to create two large gates for mini maxi for example). Right-click into space exits the edit mode.
Elevation
Requires decent internet connection
User is prompted to draw a polygon around the area he wants to evaluate. The script then automatically downloads elevation map from the internet with 30m resolution and places it into a map group. This layer (elevation) is then used for calculating AGL. The file is saved in the project's folder.
Airspace
Loads an aviation information overlay (airfields, restricted zones, TMAs, CTRs…)
Save Layers
Every geometry created in QGIS project (no-fly zones, turnpoints, gates...) must be saved in a separate file. Otherwise it will be just an empty layer. When this button is clicked, all unsaved geometry is saved in map_features folder in the project's location.
Name TPs
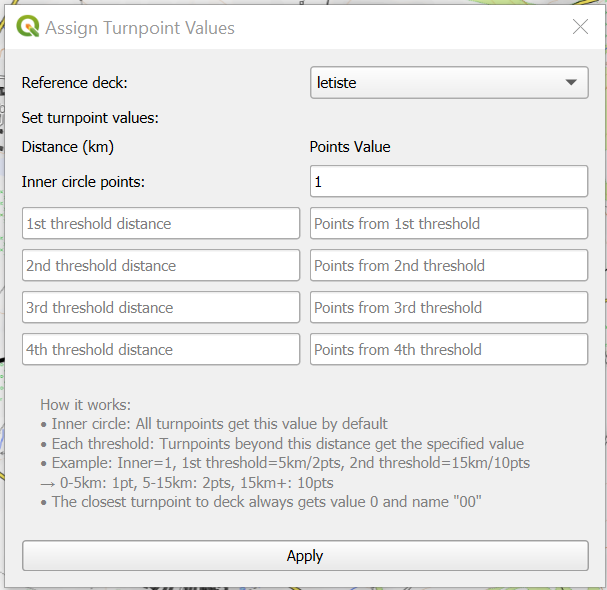
Prompts user with a dialog box where you can define values of turnpoints based on their distance from a selected deck. The nearest turnpoint can be named 00 (value 0) and usually serves as a feature for opening and closing tasks. The values are added up by the task script.
Name Gates
Select a gate_ layer and use this tool to give the gates unique names (a1, a2, a3) within the project. You can also opt to select declared gates – when a task operates with declared times, these gates will be printed in the results.xlsx for the times to be input for evaluation.
Stylize
In the Appearance tab change appearance and lables of all navigations, turnpoints, deck, and gates
The Tracks tab serves to visually check or show individual pilots' tracks. Either select a flight session from the dropdown, or click one in the layers panel. Then you can Show or hide all of it's contense or just individual pilot's tracks complete with backtracking or other guides generated by the task. You can also color-code those. It loads names from pilots sheet in results.xlsx if it's present.
In the Map tab you can choose different map types and change the map transparency. And automatically hide all layers that probably shouldn't be printed like hidden gates, layout guides, markers, height map, corridor central lines. To un-hide the gates (both free-standing and those that are part of navigation tasks) click unhide gates. To unhide the other layers, click the eye icon next to them in the layers panel. A copy of this function appears in layout maps save dialog.
Satellite
Changes the default map to satellite view.
? Button
Brings up user manual and license information. You can also deactivate the license here so it could be used on another machine.
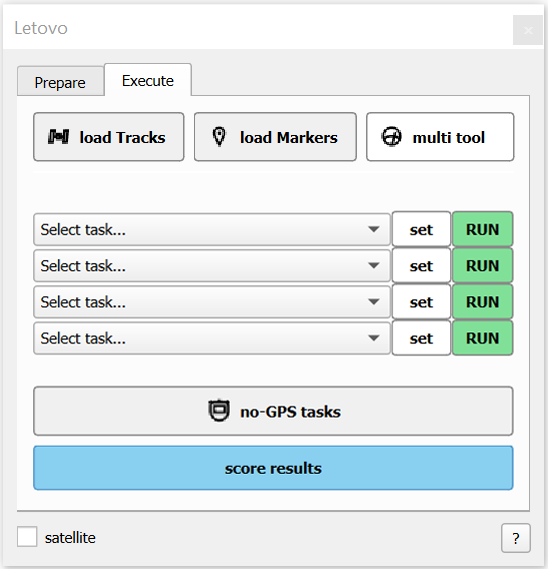
Load Tracks
place IGC, GPX, and KML files from the same flight into the GPS_data folder in your project’s location and click this button. Tracks will be loaded and saved in „flights“ group under a name of your choosing. The name of this group will also be used to name a sheet in the results so naming it accordingly to a task flown is recommanded.
The tracks are automatically re-projected into the project’s CRS, the converted files saved in processed folder, the originals in the archive folder.
The script also cleans the data (sometimes IGC files have duplicite tracks with same timestamps, but different altitude data which might mess up the evaluation)
Load Markers
this plugin comes with online and local marker interface. You can load a portion of the map into it and pilots can then place markers at their respective locations. Those are then exported into markers folder and loaded into project for evaluation into flight group, similar as the tracking data.
Multi Tool
select a pilot’s point track layer and this tool will show current AGL and time wherever you point (for checking and debugging purposes). Left-click to measure distance either by drawing a curve or by click and drag a straight line
Task Evaluation
select a group of tracks or a single track (dotted) you want to evaluate. Choose the task from the dropdown, define additional settings. You can choose to evaluate just certain portion of the track defined by time window (useful if you have multiple tasks recorded in one track) and you can trim the track further by map features (gates and turnpoints). If left unchecked the entire length of the track will be evaluated. Check additional functions most tasks have in common
• backtracking (for tasks with defined corridor). Checks if at any time pilot flew in more than 90° relative to the corridor direction. If so, the place is marked (the layer appears in the flight group) and the event reported in results.
• altitude: compares the trimmed portion of the flight to the minimum altitude defined in setup. The altitude is calculated by setting the lowest coordinates around the deck as AGL 0 and then comparing each point against the altitude layer (if present) result is printed as percentage in the results (100% means the pilot stayed above the minimum altitude for the entire duration of the flight) Note that the altitude layer pixels are 30x30m wide.
• no-fly zone detects crossing any of the no-fly zone areas defined in the noFlyZone layer and reports the events (along with names of the zones) in the results
• deck landing: attempts to check if the pilot landed into the deck. But due to imprecise nature of the AGL detection and altitude recording. It is not very precise. It’s set to be quite tollerant (there is quite a buffer around the deck) so if it shows as bad landing, the pilot probably really messed up.
Run the evaluation. If the task requires any additional layers to be selected (like specific navigation group) it asks for it. The results are then printed on the screen and user has an option to save it as xlsx or csv (if the computer doesn’t have Excel or LibreOffice installed) for further calculations. xlsx is recommended as it can work with multiple sheets/pages.
All 4 lines function the same. There are 4 of them so that you can define multiple tasks and either run them simultaniously or get back to them without having to set the times etc again.
Your settings stay saved between the sessions.
No-GPS tasks
Tasks that don't require GPS loggers for scoring (precision landing, bowling, take off, groundhandling) can be also evaluated by Letovo's scoring feature.
Fill out the "pilots" sheet in results.xlsx to take benefit of all features.
Generate sheets for different tasks and classes with pre-filled names and scoring details so that you can just type in the values and hit score. (don't hange the default headers)
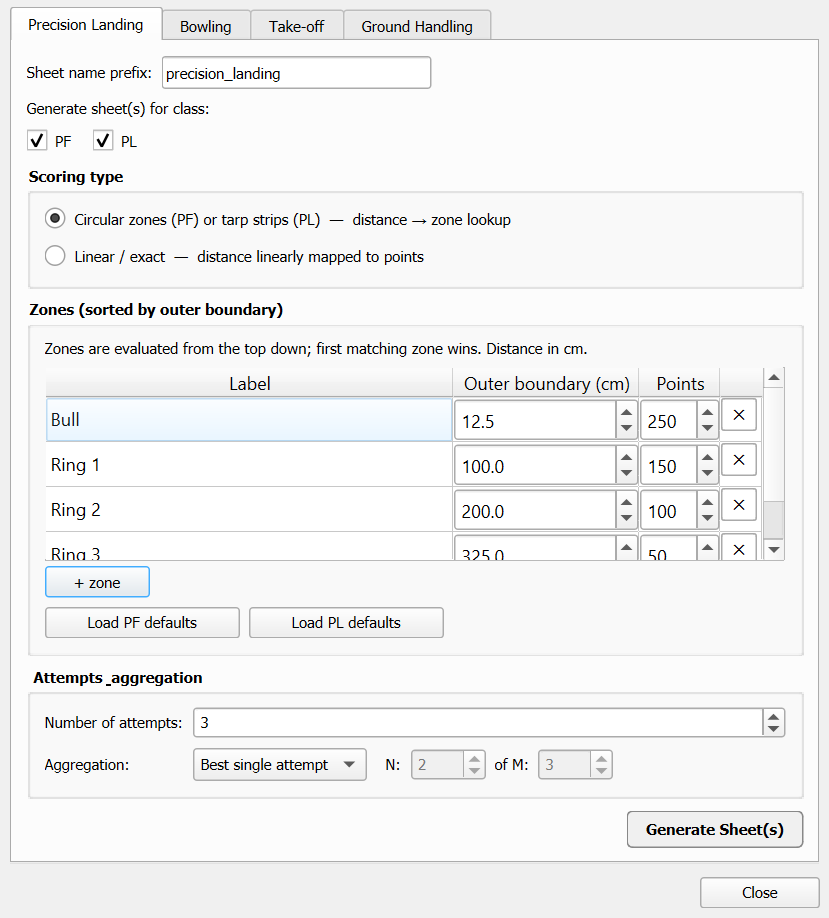
Precision landing choose a session name, select classes (loaded from pilots sheet), choose scoring: based on bullseye target rings, or exact measurement, define values and number of the target rings, define numer of attempts all pilots had and scoring type: best attempt / best x out of n / all attempts.
Bowling choose a session name, select classes (loaded from pilots sheet), define number of pins (for all attempts or adjust individualy), and number of attempts
Take-off choose a session name (this task is usually bundled with other task), select classes (loaded from pilots sheet), define score based on the number of attempts
Ground Handling choose a session name, select classes (loaded from pilots sheet). For various tasks performed on ground within a time frame. By default generates just one column "Pass / Fail" (fill 1 / 0) but can also include the exact time it took the pilot to perform (1 minute 30 would be filled as 90)
Score results
Tool that looks for results.xlsx in the project folder and brings up an interface with every available sheet. It will guess what task was the sheet about or you can select the task from the dropdown, and then choose the metrics for evaluation. Select what value is preferable lower (for things like time on speed circuit, or time difference in declarations), or higher (like turnpoint score or distance), set up the weight each metric should have (for speed triangle and distance task it can be 50% for triangle, 50% for distance, for example), and select what penalties should apply. Those can be proportional, like percentage of altitude flown above minimum, they can be x0 (0 score for breaching no-fly zone), or ignored completly. Select which of the tasks you want the scoring be aplied to and hit "score".
The tool will generate 4 columns on every sheet: raw score, raw score with penalties aplied, normalized score (0-1000), and a breakdown with the calculation visualized.
It will also look for the pilots sheet. If it is filled with the names of the pilots, their classes and something that their tracks have in common - (depends on what logger you're using and how it names it's output data. It can be the pilot's name, his number, the device ID.. The ID2 column is for device replacement or backup if it changes throughout the competition). If this sheet is filled out, another sheets will be generated based on the class, with the pilots listed and their overal scores linked to the calculations in all the scored sheets their IDs appeared in.
Tools connected to printing and exporting the maps
Print Area
There are 2 options
full competition area – let’s you define the level of zoom you want to work with. This is then saved as an image in the map folder (just the plain map) and loaded into the project above the interactive map that has different amount of detail depending on how close you zoom on the screen. This feature is especially useful if you want to use QGIS without internet connection or use the default QGIS functions for publishing the project (in that case QGIS automatically uses the level of map detail fitting your map size without the option to show more detailes but smaller)
selected area is to save a portion of the map with world files. This can be then loaded into the map folder of marker interface. The world file makes sure that the markers pilots place on the map load in the right position within the project.
You can also use this function to export a section of the map that you want to send to a competitor.
Layout Maps
Bypass the QGIS layout manager which doesn’t work well with Mercador projection and Ellipsoidal measurements.
Choose the format of the pages you want to print the maps onto and the map scale (default A3 and 1:66666 – 1.5cm = 1km). Position the rectangles representing the papers accordingly. Click and drag the edges to move the pages, left-click adds more pages, right click on the edge removes them, right click into empty space finishes editing.
Click the tool again and choose save. Plugin will save the maps into „print“ folder with page numbers and numbers of the neighbouring, overlapping pages so you can then bind the maps and treat them as a road atlas.
By default the pages overlap by 1km and keep the deck layer at the center of the 2x2 grid (so it appears on all maps). After the save dialog, you can also choose to hide layers you usually don't want to be printed (hidden gates, layout guides, markers, corridor central line..), and turn on or off automatic page numbering.
TP List
creates an A4 pages with a grid of all the turnpoints zoomed in with more detailed map and saves them in the print folder of your project (make sure to hide the layer with full competition area if you're using it)
Guide
This section provides detailed information about task evaluation scripts and competition management workflows. Each script is designed for specific competition formats commonly used in paramotor events.
00_template_task
Expects selected track or group of tracks.
Measures time, distance, average speed, percentage of flight above certain altitude, no-fly zones violations, deck landing (inconclusive) Can be used for pure economy task
Navigation tasks
11_pure_navigation
Expects a navigation group (or nav_(name) layer), and track (or group of tracks) selected.
Calculates percentage of the flight within the corridor by subtracting the length of the flight outside of it. (If corridor was 1000m and the pilot left it for 100m, result would be 90%)
Checks for backtracking (defined as flight at more than 90° compared to corridor within the defined corridor width).
12_turnpoints_hunt
Expects a track selected and OB layer present in the project.
Script adds up values of all the unique turnpoints entered along the flight. If all turnpoints are collected in one flight, pilot can start collecting them anew. In this second round, all turnpoints have a value 1.
13_declared_times
Select group or track layer.
When running the task for the first time, you can define features where the time is declared (the first feature is time 0 by default), and hidden gates between them (if you placed any). If you've placed all the hidden gates at once (without saving the layer), they are all marked with the same letter and you can select them via that letter, or individually.
You can also define the maximum penalty used when a feature is missed or time is way off (default 180).
When you run the task 1st time it will look for a sheet with the task name and list of competitors with declared times within results.xlsx. It will create it if it's not present and report error. You can now populate the created sheet with pilots' time declarations (SS format), and run the script again.
The script then loads the times compares them to the times of crossings (when crossing turnpoints, the 1st entry is marked), and prints the differences. As well as number of defined hidden gates and how many each pilot crossed.
If pilot misses the 1st feature, he receives max penalty for it and the next feature is considered as time 0, reducing the declared times accordingly as to not make the whole task invalid. The total flight time and distance between the trimming features and the usual checks are also noted.
14_average_speed
Expects gate_(name) layer or a navigation group (with „gate_(name) layer present) and a track layer (or group of layers) selected.
Looks for features with dec=1 (declared), makes a sheet (named after whichever was selected last) in the results.xlsx with pilots names and names of the declared features.
Declared times must be entered (format SS). Calculates average speed for each section based on distance of the gates along the corridor line and the declared times. Calculates expected times of crossing for non-declared gates along these segments. Checks these times against the measured times. Adds up all the differences (max difference is 180, same as penalty for missing a feature completely).
15_marking_markers
Expects „Markers" layer and a group or layer with loaded markers selected.
This task expects the scale of the map to be 1:66666. Measures distance of placed markers (via web interface) from the marked features (within 2mm radius 1pt, 5mm 0.5pt). And checks the symbol marked (1pt). If there are multiple spots marked within one marker, prints „doubletap" and counts all of them together as 0.5pt (even the correct identification is for 0.5 in this case).
Prints number of markers used to markers present in the map (to check for spamming). This task isn't matched with flight track (different naming). The markers are being loaded from a „markers" folder located where project file is.
Economy tasks
21_triangle_distance
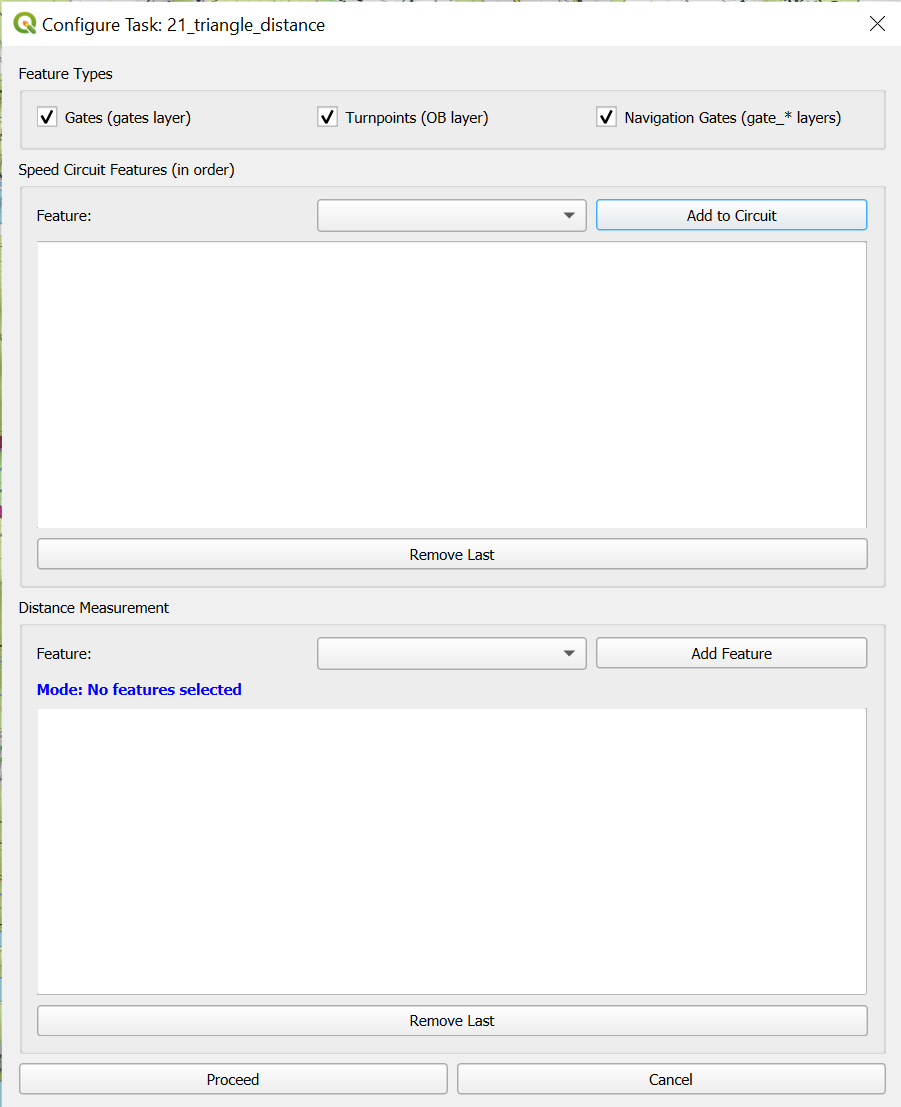
When running the script 2 sets of features are defined:
Features forming a circuit (possibly triangle), and 2 features defining a line (between their midpoints). Time is measured between the first and last of the features of the first list and then the distance of the furthest crossing of the line (measured from the 1st point). A guide line is created in the flight group for visual verification.
If any of the first set of features is missed or the pilot fails to cross the line, it's reported. If only one feature is selected for the distance measurement, pilot is free to choose the direction and the absolute furthest point on track is measured.
22_distance_circuit
Expects track or group of tracks selected.
Prompts user with selection of features defining the circuit (usually gates). Features must be in order as on the circuit.
Starting with any feature, counts laps, each feature is counted as a fraction of the lap. Checks for backtracking events: double crossing one gate or crossing gates in wrong order. Returns number of laps, total distance and time flown between first and last crossed feature and the usual optional checks.
23_out_and_return
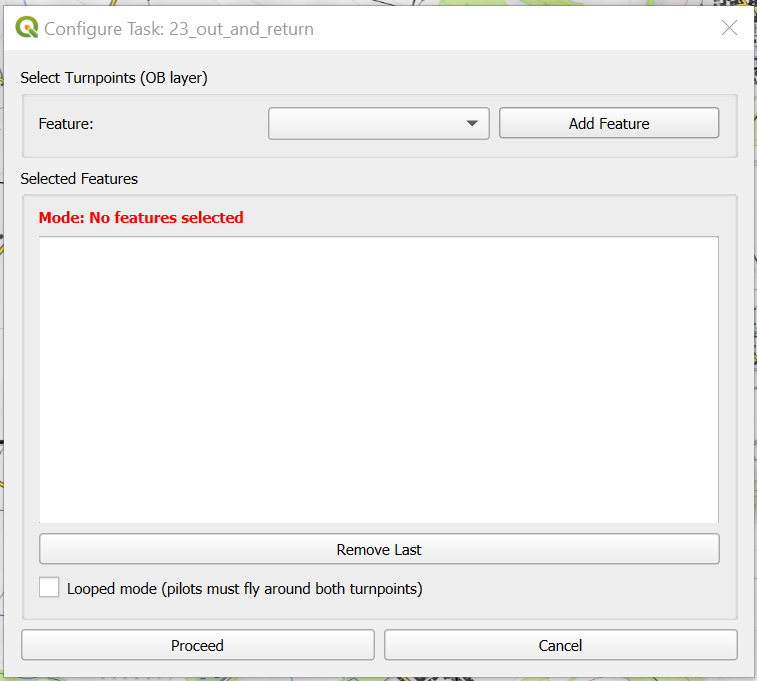
Expects track or group of tracks selected.
Prompts user with selection of 2 turnpoints. Draws a line from the first one to the second.
There are two variations of this task:
Normal - measures the furthest crossing of this line.
Looped – pilot must first fly around (or through) the 2nd turnpoint (without crossing the line before), then fly back and around or through the first one, and only after is the next crossing measured (only one crossing is allowed) any other sequence results in error.
If just one turnpoint is selected, pilots are free to choose the direction and the furthest point after crossing the turnpoint will be measured.
24_triangle_size
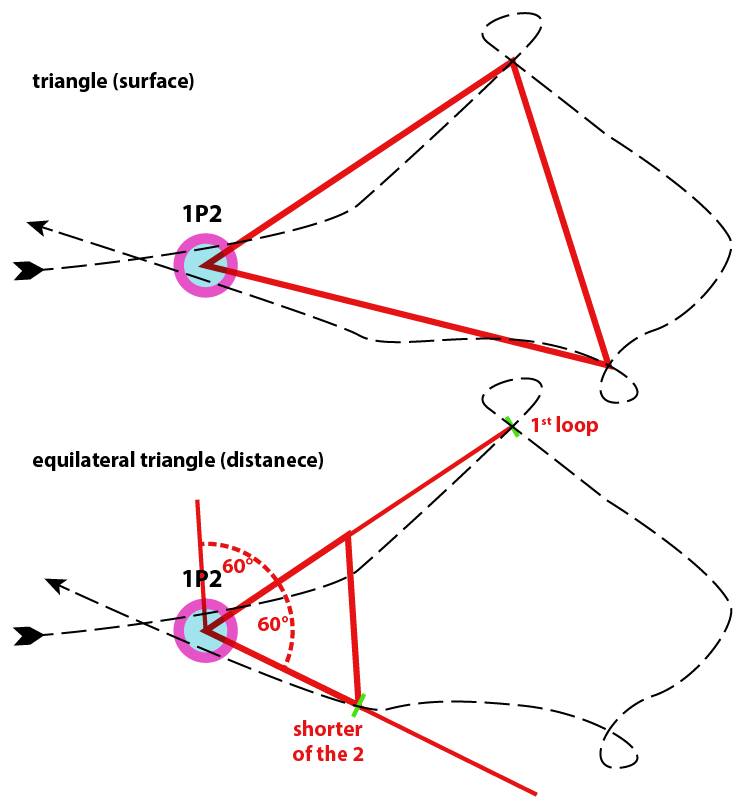
After defining one feature, you can choose 2 variations of a triangle task:
Triangle surface – triangle is defined by middle of the feature and two loops.
Equilateral triangle – first loop forms one side of a triangle and script checks for crossing of the other side. The distances from the feature are measured and the shorter one used to form the triangle.
Both triangles must be closed by crossing the defined feature the second time.
Technical tasks
31_mini_maxi
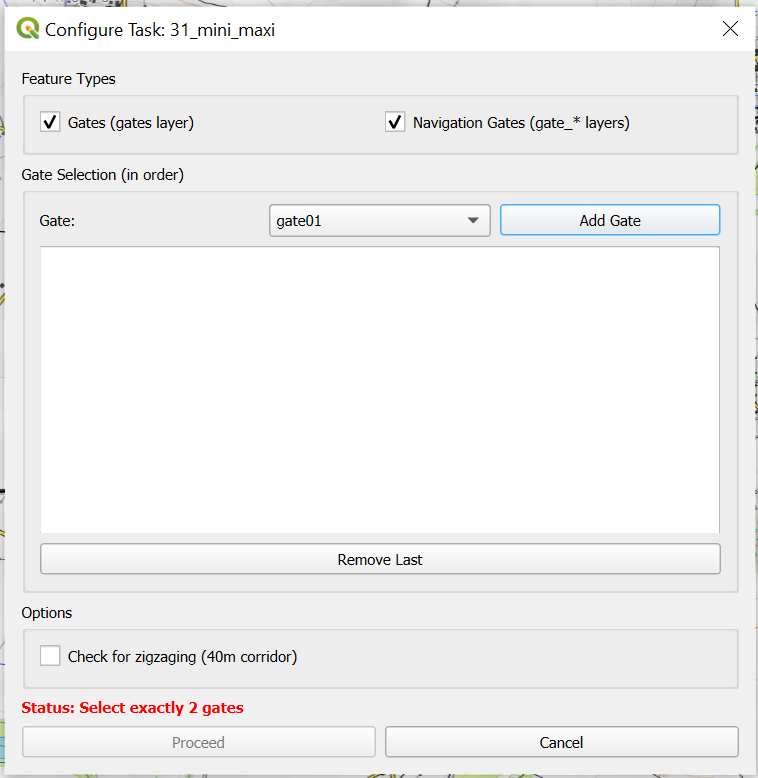
Expects selected track or a group of tracks.
2 gates are defined and an option to check, if the pilot didn't zigzag.
Script is looking for 2 crossings between 1st and 2nd gate, measures both times of flights between them and calculates the difference between them. The bigger the difference, the higher the score.
Multiple crossings of the same gate (crossing the 2nd gate on the way back to the second round for example) are ignored → multiple flights can be ongoing side by side on the same gates.